| THERMO Spoken Here! ~ J. Pohl © | TOC NEXT ~ 93 |
2.8 Ideal Gas and its Temperature
A brief explanation of how the ideal gas equation was developed (about 250 years ago) is helpful in learning to use it. Studies of typical solids and liquids (the condensed phases) showed their densities to be inconsequentially influenced by changes of pressure and/or temperature. But for gases, every condition not standard exhibits a different density. Concurrent with studies of gases were development of temperature scales and thermometers. Two phenomena of specific interest for thermometers were the temperatures of water, during freezing and while boiling at one atmosphere. With these easily reproducible physical conditions as base points, two temperature scales were defined: the CELSIUS (or centigrade) and the FAHRENHEIT scales. Thus began ideas about temperature.
IDEAL GAS BEHAVIOR: Among the many early studies made
 possible by temperature scales were the inter-relationships of gas properties: temperature, pressure and volume. Briefly recounted, in the early 1600's Charles, Boyle, Gay Lussac, et al, experimented with air and other gases at low pressures. A brief composite of their observations is portrayed in the figure. They determined:
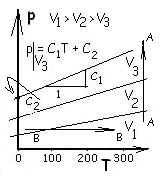
♦ At constant temperature the volume of a gas decreased as its pressure increased. Shown in the figure as the upward A - A path.
♦ Were pressure maintained constant, the volume of a gas would increase as its temperature increased. Shown as the B - B, a line left to right.
Pressure-temperature relations of light gases at different volumes (held constant), that is data for p = p(T,Volume = constant) over the temperatures available then, are straight lines with the awkward equation form:
| p(T)|V = const. = C1T + C2 | (1)(1) |
Look at this equation form. Shown above right is what the 1850 scientists knew. Shown below right is what their data imply or "seemed to say."
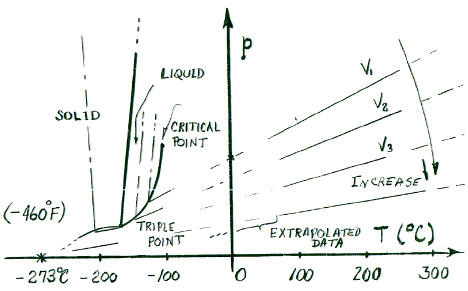
Further inspection of the data revealed lines of pressure versus temperature (on a constant volume path) to be straight. It appeared the lines, upon extension (to low temperatures unavailable then) would intersect the temperature axis. Most data indicate a temperature (by straight line extrapolation) at which gases would have "zero" pressure. The lines show a convergence
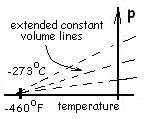 at some, new and very cold temperature.
At the times of these investigations, temperatures lower than 0°C (32°F) were difficult to produce in the laboratory.
So the scientists extrapolated the data to lower and lower temperatures (i.e., to the limit "zero pressure'). As close as they could determine, all paths of constant volume lead to a single crossing of the temperature axis. In terms of temperatures known then, the crossing temperature was very cold and negative. Careful numeric extrapolations indicated these temperatures to be -273°C (-460°F).
Those studies forced the temperature scales of that time (and now) to include a new perspective - Ideal Gas Temperature.
Thus, it was discovered that by changing the temperature scales (to have a new "zeros") all ideal gas data could be represented analytically in a much easier, logical "ideal gas equation" form. The two new "gas" temperature scales developed were the Rankine scale and the Kelvin scale. The principal use of these scales is for calculation of ideal gas behavior. For that reason these temperatures are called ideal gas temperatures (and, by some, absolute temperatures).
With the new temperature scales, it became possible to generalize the data of gases, to be called "ideal gas behavior." The state properties of an ideal gas (p, v, ρ and T) can be described
 by a single, analytic equation having a single constant of proportionality - the gas constant, designated by the symbol,
R(capital letter, R with an over-line). Some authors call this the "Universal Gas Constant."
by a single, analytic equation having a single constant of proportionality - the gas constant, designated by the symbol,
R(capital letter, R with an over-line). Some authors call this the "Universal Gas Constant."
For calculations that do not involve chemical change, it is convenient to immediately make the gas constant R specific to the substance being considered by writing R/M where M is the molecular weight of the gas. This practice works well for engineering solutions.
The ideal gas equation written for use with masses of gas is:
| (2)1 |
The above is an extensive form of the ideal gas equation, meaning suited for calculations where the extensive variables, volume (dimension ~ L3) and mass (dimension ~ m) have relevance. A minor algebraic change yields an intensive form which is convenient to use.
| (3)3 |
Values of the Universal Gas Constant in different units are:
| (4)4 |
The gas constant is widely used in thermodynamic design. Thus, its value, in at least in one unit system, should be memorized.
GAS CONSTANT UNIT CONVERSIONS: Values of the The Gas Constant (with units) must be learned to deal with gases. But once learned, the constants are very useful as "unit conversion tools."
This is a conversion to obtain the calories in a British thermal unit.
 | (5)5 |
The Kelvin temperature scale has 100 degrees increments between the "freeze" temperature and the "boil" temperature of water. The Rankine scale has 180 degrees between the same water-standard temperatures. Thus 180 increments of Rankine degrees is equal to 100 increments of Kelvin degrees. We write this equivalence as: 1 = 1.8R / K. A kilogram equals 2.2 lbm. Make these conversions:
| (6)6 |
And with a little algebra and rearrangement:
| (7)7 |
This conversion determines the number of Joules in a British thermal unit.
| (8)8 |
If you are on a date and things are boring, use the gas constant to determine the number of calories in a Joule.
Modern engineering equipment has managed to create and sustain very cold temperatures for the further study of ideal gases at lower temperatures. It was anticipated and discovered that as gases became colder (at constant pressure) they adapt but then at some temperature, each changes to its liquid phase. Then the liquid, being further cooled to still lower temperatures - ultimately adjusts by phase change to its solid phase. The graphic below depicts how the lines of "perfect gas behavior (first figure above)" change as all substances cease to be ideal gases at low temperatures. The right side of the figure is a phase diagram for a gas. The phase diagram for water is a topic of Chapter 4.
2.8 Ideal Gas and its Temperature
A brief explanation of how the ideal gas equation was developed (about 250 years ago) is helpful in learning to use it. Studies of typical solids and liquids (the condensed phases) showed their densities to be inconsequentially influenced by changes of pressure and/or temperature. But for gases, every condition not standard exhibits a different density. Concurrent with studies of gases were development of temperature scales and thermometers.
Premise presently unwritted!