| THERMO Spoken Here! ~ J. Pohl © | TOC NEXT ~ 191 |
4.00 Thermodynamic Properties
Energy, singular case, as in "the energy of a system," means the SUM of ALL of energies, however categorized. The energy of every substance can be changed by subjecting it to compressive force. Stated otherwise, every substance, solid or fluid, has a minimum of one work mode which is the compressive work mode. This writing addresses the properties of simple compressible fluids.
The base thermodynamic properties of simple compressible substances are its pressure, temperature, specific volume and specific internal energy. Although pressure, temperature and specific volume are measurable properties, these three are insufficient information for engineering design. Internal energy is needed for analysis but it is not measurable; no gages or instruments exist that report the internal energy of a substance.
Internal energies of substances are deduced, made quantitative by terms of their p-v-T behaviors. A very large branch of physics and thermodynamics is devoted to the p-v-T measurements and calculations required to quantify specific internal energy (enthalpy and entropy). A complication of these endeavors is that substances exhibit three phases with markedly discontinuous behavior when phase change occurs. Our first task is to familiarize ourselves with phase behavior and its descriptive tool, the phase diagram.
Ice, Water and Steam Of all substances, water is the most extensively studied. The basis for study of its thermodynamic properties is pure water. Investigations of water over broad ranges of imposed pressure and temperature, reveal distinct domains in p -T space in which water is solid and other domains in which water is liquid. Elsewhere in the p - T space, the water is gas (or vapor or fluid with minor distinctions). This information, presented graphically on pressure versus temperature coordinates, is called the phase diagram of water. Our discussions amount to presentation of experimental fact.
Phase Changes of Water Our first figure (below right) is a beginning phase diagram for water. The information, species of matter (water), molecular weight (18.0) and phase at STP 101.3 kPa and 25 °C (water) are called the standard state information of a substance. The state is notated on the phase diagram (SS). The notation, "liquid," (in the vicinity of the standard state) means that all proximate states are known, by experimentation, to be liquid. Next we consider three processes for an arbitrary mass of water. In each case the initial state is standard. The first two processes occur with pressure maintained at one atmosphere. In thermodynamics, the word normal means "at atmospheric pressure." Another term used is "room temperature" which mean means approximately standard temperature. In each of the cases below, assume we have a temperature measuring device inserted into the water.
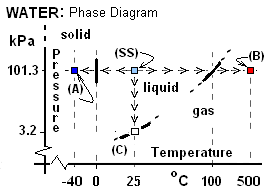
Normal Freezing: In this event water, cooled at constant pressure, follows a path of states starting at SS then moving horizontally to the left as indicated below (right to left): "(A) <-<-<- || -<-<-< (SS)."
The water temperature diminished in a steady way from 25°C until 0°C, whereupon its temperature held constant and solid phase began to form. Thus the coordinates, pressure - temperature pair, 101 kPa, 0°C, mark a first point on a liquid-to-solid phase boundary of water. Cooling thereafter change all of the water to solid and thereafter the ice temperature diminished in a steady way, to -40°C. The region in the vicinity of state A is marked "solid." In summary, the cooling event changed the entire mass of water to solid at a special temperature.
In was in 1742 that a Swede named Celsius (who was constructing some of the first thermometers) designated the temperature of freezing of water event to have the numerical value (or temperature magnitude) of 0°C. Other information are that the volume of water increases about 4% increase upon freezing and that the thermal energy or latent heat of freezing is 333 kJ/kg.
Normal Boiling: For this event a glass of water at STP was placed in an electric stove set to attain 500°C, once turned on. The ensuing path of state change of water is depicted on p-T coordinates as "(SS) -<-<-< || <-<-< (B)." The heating changed the temperature of the water steadily until boiling (liquid to gas phase change) commenced. Celsius observed the same temperature in 1742; he defined the temperature of this phenomenon to be 100°C. Thus the coordinate pair, 101 kPa, 100°C mark a first point on the boundary of liquid-to-gas phase change. The temperature of the water was observed to remain 100°C until all of the liquid became gas. Further information about water changing from liquid to gas are: the water exhibits about a 1679cm3/g increase of volume and a thermal energy increased of 2252 kJ/kg. With further heating the water attained the temperature, 500°C.
Boiling at Room Temperature: While some might wonder how water could boil at 25°C, many of us have observed that event in a physics laboratory.
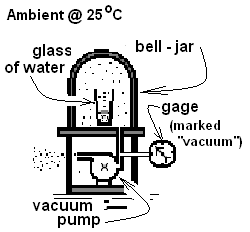
The sketch shows an apparatus which consists of a supported, platform-like base. A glass of water is placed on the platform then enclosed by the bell-jar which seals at its contact. A hose, connected to a port in the base, leads past a pressure gage to a vacuum pump which is turned on. The pump acts quite slowly such that time is available for the room, water in the glass and apparatus to remain in thermal equilibrium. The temperature of the water within the bell jar will continues to be its original, room temperature, 80°F.
Initially, the pump extracts air from the space and the reading of the Bourdon vacuum gage (with "vacuum" written on its face) is: 0 kPa. In time, however, the gage will indicate an increase in reading as pressure within the bell-jar becomes steadily less than the room pressure - atmospheric. In time most of the air will have been expelled - only liquid and vapor water will remain under the bell-jar. Later, the gage reading will cease to decrease and bubbles of water vapor will be seen forming within the water. The appearance of water boiling at 25°C is similar to boiling at 100°C but less violent. The pressure-temperature pair associated with this boiling point mark a liquid-gas phase boundary for water. The reading on the face of the pressure gage (GR) would be seen as about "98 kPa Vacuum," meaning the pressure of the gaseous water inside is (101.3 - 98) ≈ 3.2 kPa. Or in EE units the reading would be "14.2 psi Vacuum," meaning the water pressure is (14.7 - 14.2) ≈ 0.5 psi. Recall that gages do not report pressure. They report a gage reading, which is a pressure difference.
In summary, these three events illustrate the determination of three points on the phase diagram of water which are at phase boundaries. These coordinate pairs, (101.3 kPa 0°C) (101.3 kPa 100°C), and (98 kPa, 25°C) when supplemented with a great many other pairs permit representation of phase boundaries as lines which are borders between regions or domains of phase in the p-T space. A completed set of such data when graphed, constitute a phase diagram of the substance.
Phase Diagram and p-v-T Surface The energy-related properties of water are pressure, temperature, specific volume, specific internal energy, and specific enthalpy: p, T, v, u and h. (Entropy is a topic of other texts). Since internal energy can be expressed as "u = h - pv," only the four properties, p, T, v, and h need be considered. An explanation of "dependence" is in order. In a laboratory, were one to impose on an amount of water, a specific (but randomly selected) pair of values for temperature and pressure, say T* and p*, the water would innately select and exhibit its measurable property, specific volume as v* = v(p*,T*). The inner energy or molecular structure of water itself "makes the decision," as to the magnitude: v*. Also decided by the water molecules is h* = h(T*,p*). (This is the case for all T*-p* pairs except those belonging to the phase boundary set). Thus a single, T* and p* set of data establishes a state or single point in the p-v-T space of water and results of vast experimentation (many many more sets) have produced (at least conceptually) a state space relationships among properties of a substance called its p-v-T surface. The surface is reasonably smooth with discontinuities at phase boundaries. The p-v-T surface for water is represented below left. To its right its p-T projection is sketched which we know as the phase diagram.
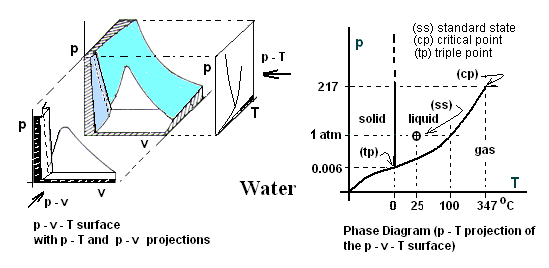
For our purposes only a small, beginning level understanding of p-v-T behavior and its special aspects is required. The p-v-T landscape of water will be introduced only with respect to the plane, pressure equals one atmosphere. Thermodynamic properties of substances at one atmosphere of pressure are called Normal data or normal properties.